Case studyInternal platform
Retail Market Monitor
A read-only market view for a hi-fi distributor. Each morning it reads about thirty independent retailer sites, matches every listing to the right catalogue product and shows where their prices sit. It never changes a price.
Client not named publicly. Everything below is accurate; only the attribution is withheld. Happy to walk through the work in detail, and introduce you to the client, on request.
- Python
- AWS Lambda
- AWS SAM
- React
- TypeScript
- Cognito + MFA
- retailer sites read each morning
- ~30retailer sites read each morning
- hand-checked prices must agree to pass
- 48 of 50hand-checked prices must agree to pass
- prices changed, and no writes to the store
- 0prices changed, and no writes to the store
- Python and web tests run before every deploy
- 225 + 21Python and web tests run before every deploy
Keeping track of what independent retailers charge is usually manual work: open the sites, compare the numbers, update a spreadsheet. This tool does that reading every morning and presents the result as a market view. It is for internal use, it only reads, and it is deliberate about what it claims.
Reading the market each morning
A scheduled job reads about thirty independent retailers' websites. For each one it takes whatever the site offers, then sets the result beside two other sources that do not depend on the retailers at all.
- Three kinds of retailer source: sitemaps, the structured data on product pages, and store product feeds
- Google's market price benchmark, kept beside every retailer price as an outside reference
- The distributor's own catalogue, read-only: nothing in the system can write back to the store
Matching listings to products
A retailer's title for a product never quite matches the catalogue's. Matching each listing to the right product is the hard part of the job, because a wrong match makes every number built on it wrong.
- Weak or tied matches go to a human review queue instead of being guessed
- Every decision can be undone
- A rejected match stays rejected, so the same wrong pairing does not return the next morning
Showing where the market sits
The screens are built around one question: where do retailer prices sit against the distributor's reference price? Each view answers it at a different scale.
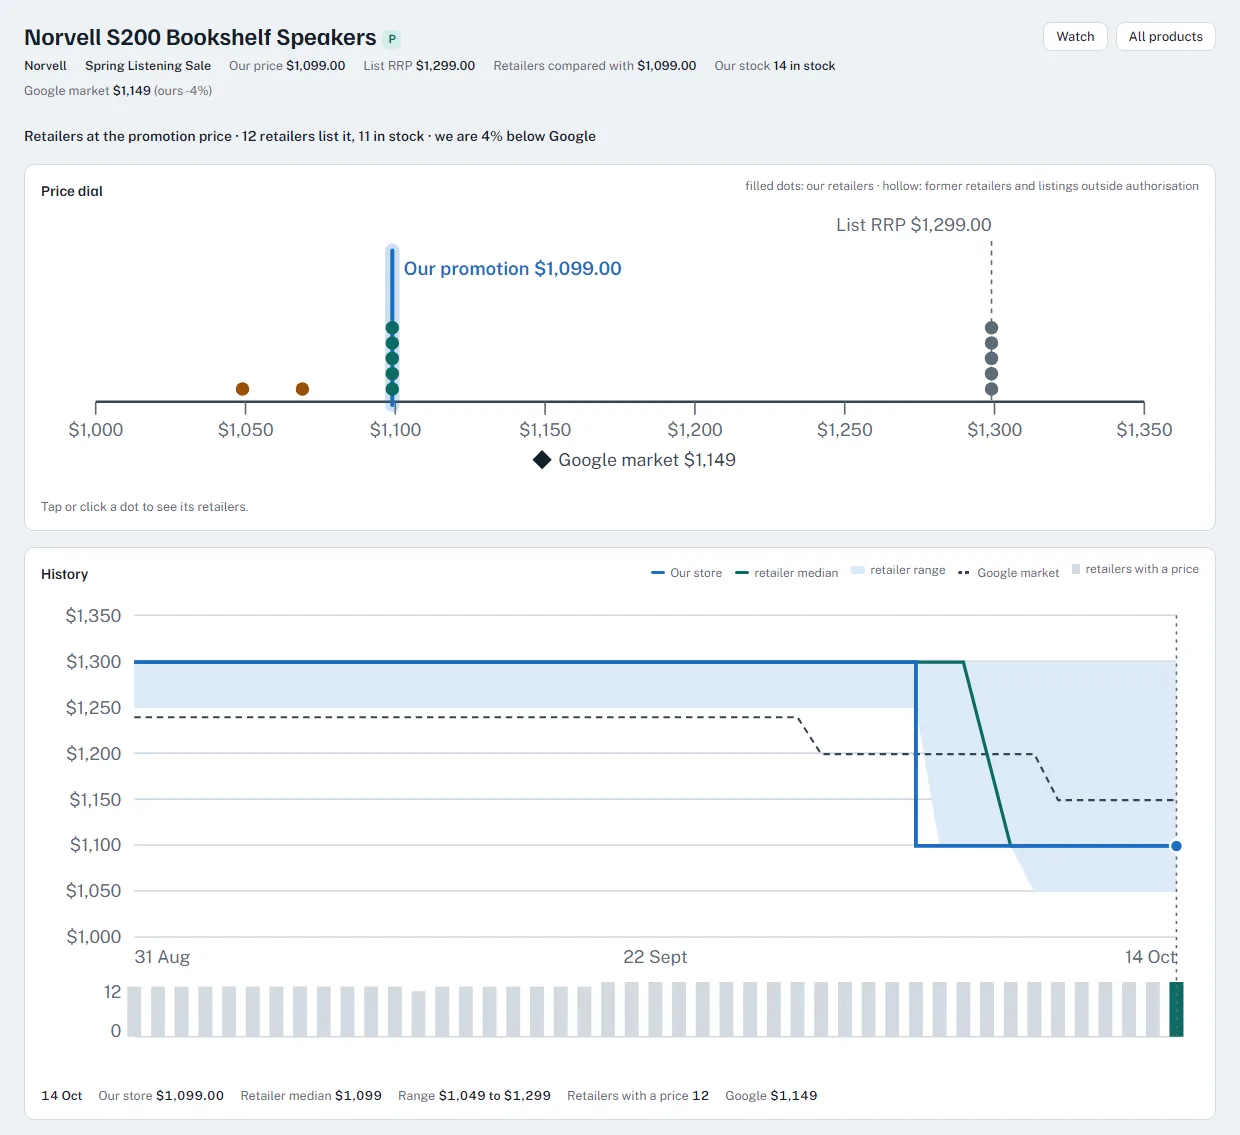
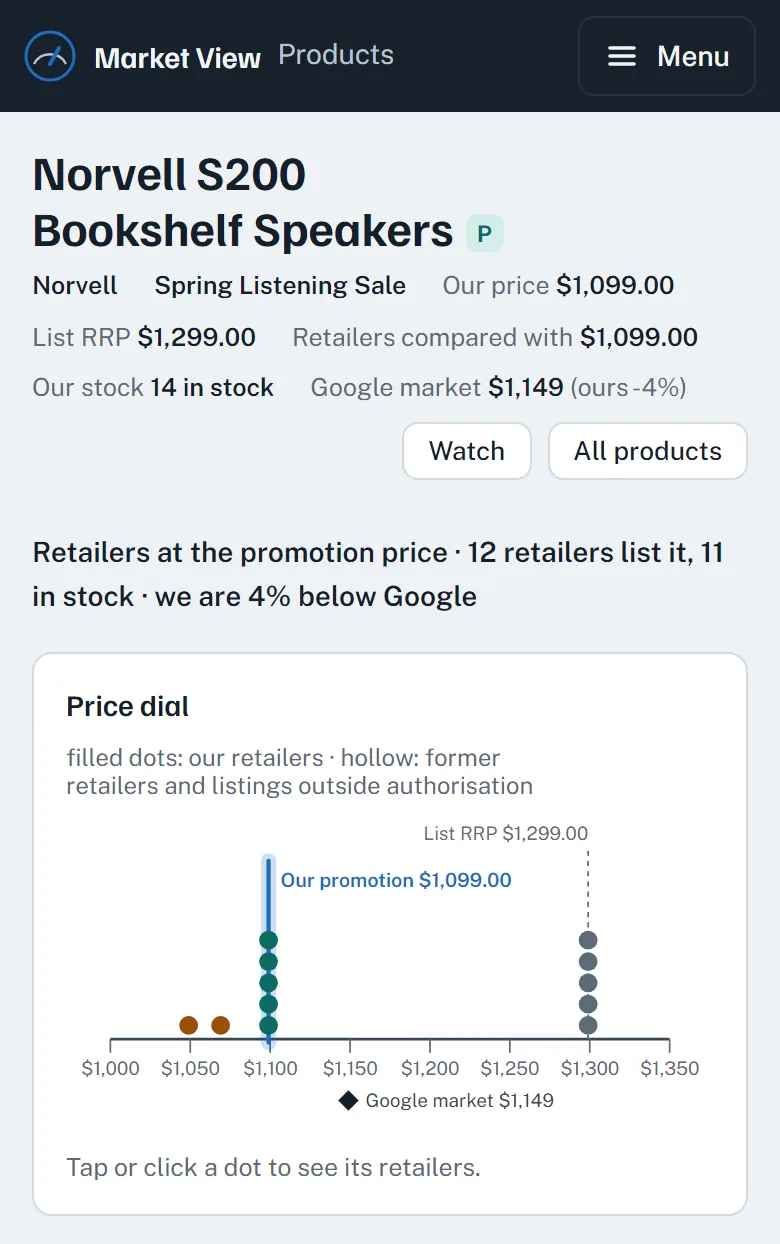
- A price dial on every product page puts each retailer around the reference price, and a history chart shows how that picture has moved
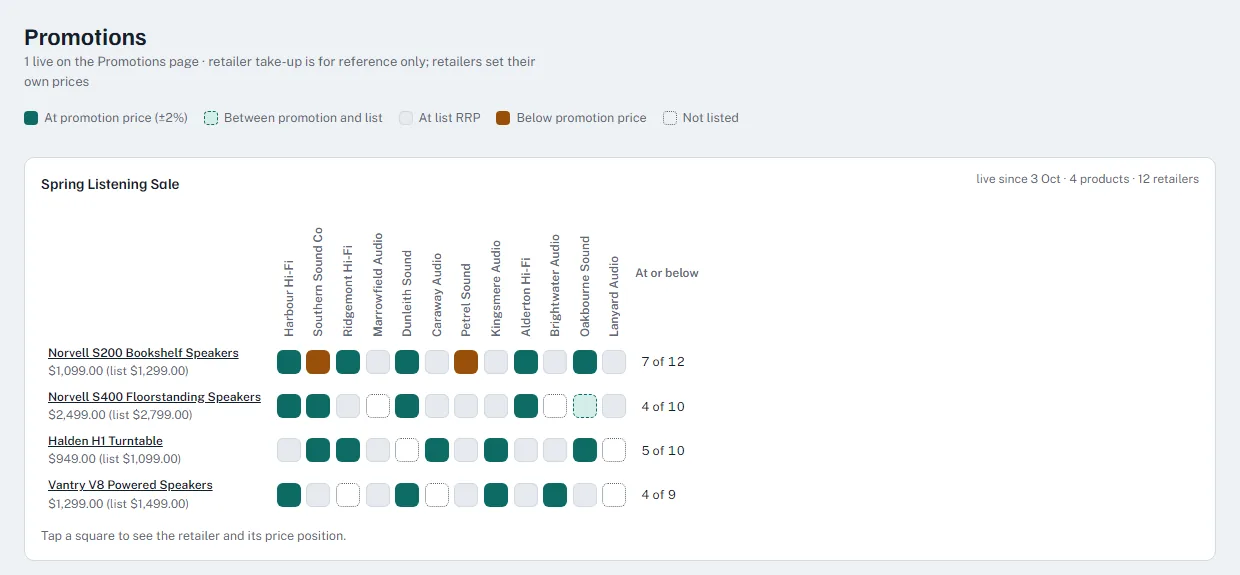
- A product-by-retailer grid shows whether retailers follow each live promotion
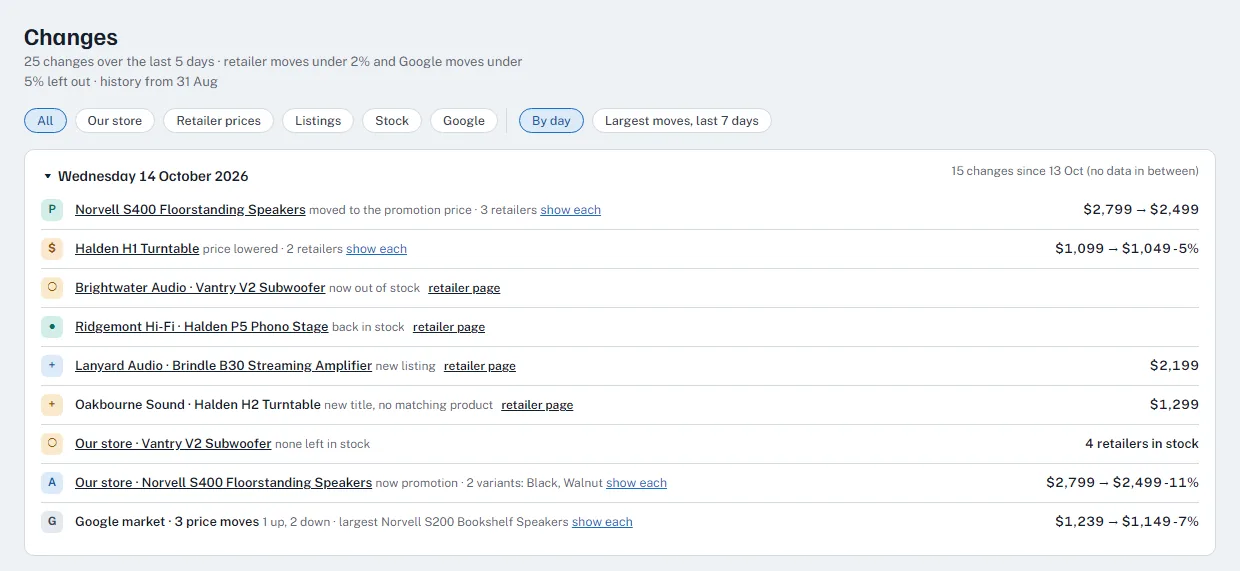
- A changes feed groups the same move at several retailers onto one line
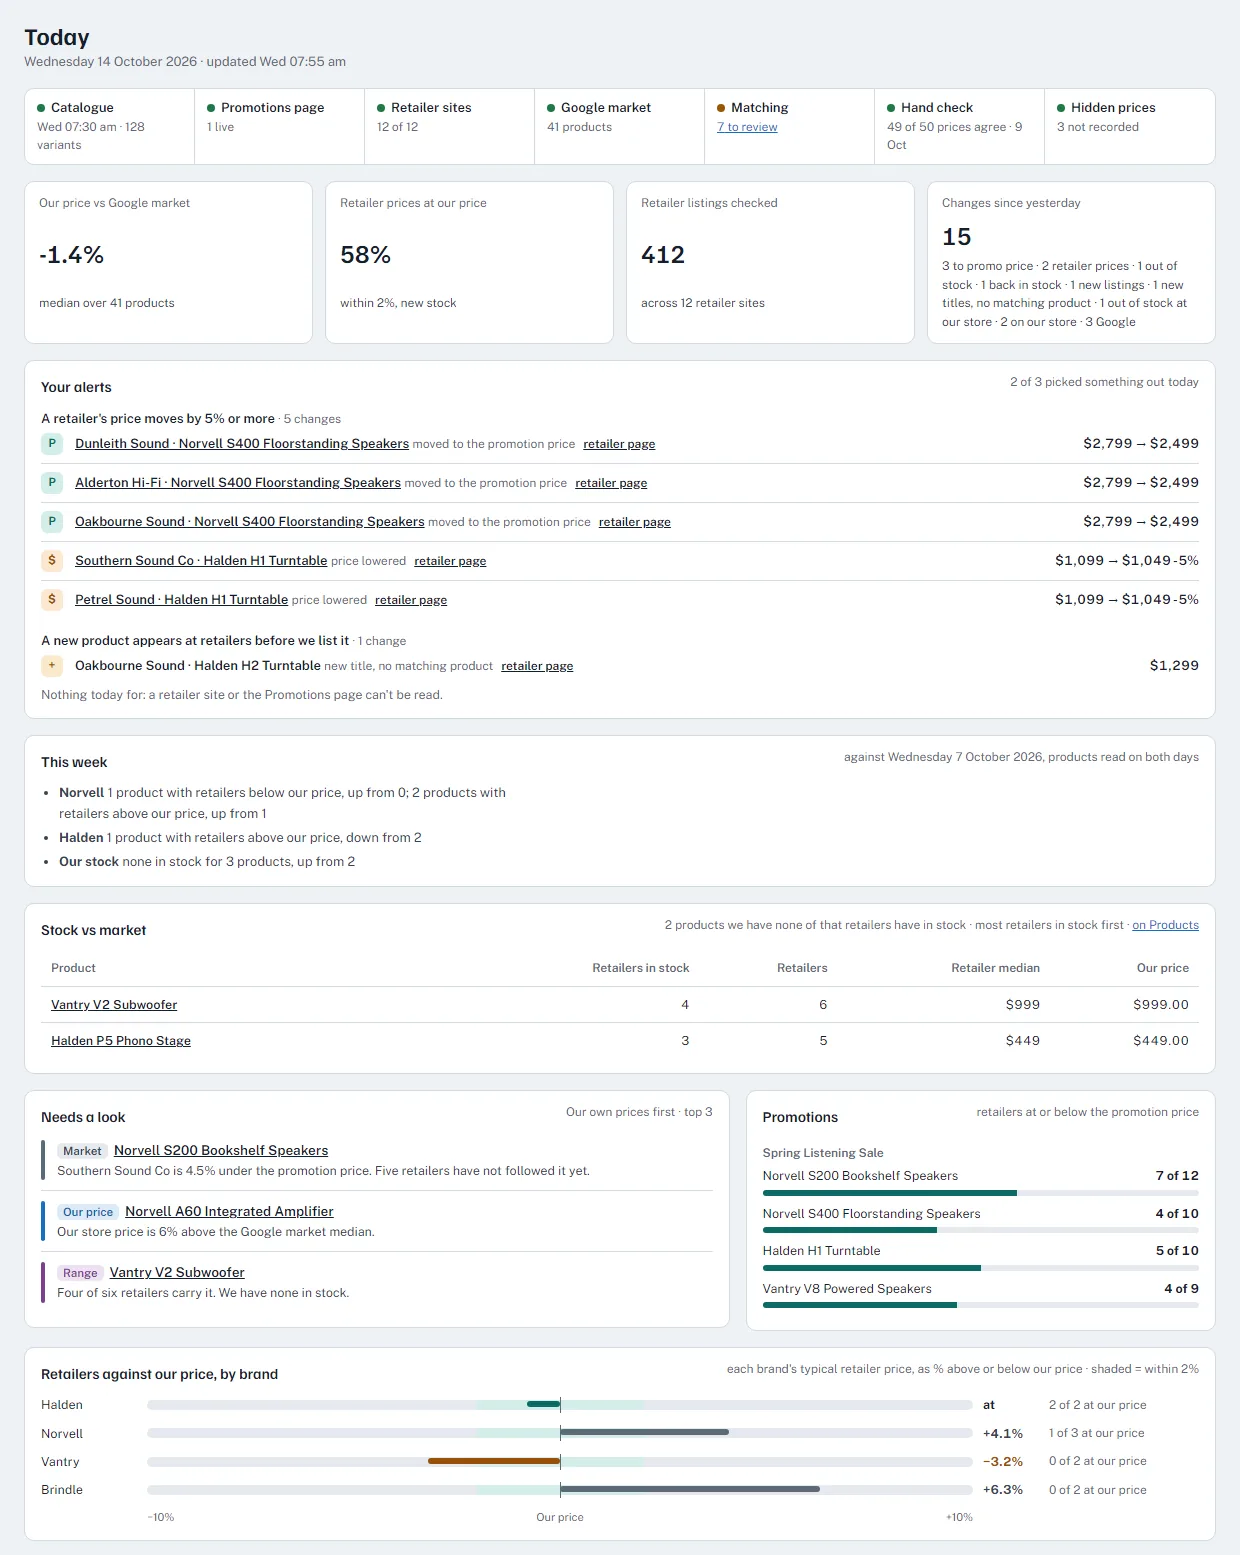
- Per-person alerts, and a stock view of products the distributor has none of while retailers do
Built to be trusted
A tool that reports on other businesses' prices has to be careful about two things: being right, and what it gets used for.
- It never changes a price and never writes to the store
- It describes the market and is never used to pressure retailers. The wording throughout is neutral, with competition law in mind
- An append-only audit log, enforced by a bucket policy rather than by application code
- A hand-checked accuracy sample, with a pass mark of 48 correct out of 50
How it is delivered
The backend is AWS serverless, defined in SAM: Python Lambda functions, S3, an API Gateway HTTP API, EventBridge schedules and SES for email. Sign-in goes through Cognito with TOTP multi-factor authentication. The front end is React 18, TypeScript and Vite, with phone layouts designed on their own rather than squeezed down from the desktop ones.
- A morning email digest, one per person per day, safe to retry
- A weekly report as PDF and CSV
- 225 Python tests and 21 web tests run in CI before every deploy
Screens
What it looks like
The real interface, rendered with invented retailers, brands and prices.
 (opens the full-size image in a new tab)
 (opens the full-size image in a new tab)
 (opens the full-size image in a new tab)
 (opens the full-size image in a new tab)
 (opens the full-size image in a new tab)